

How does this scatterplot work?
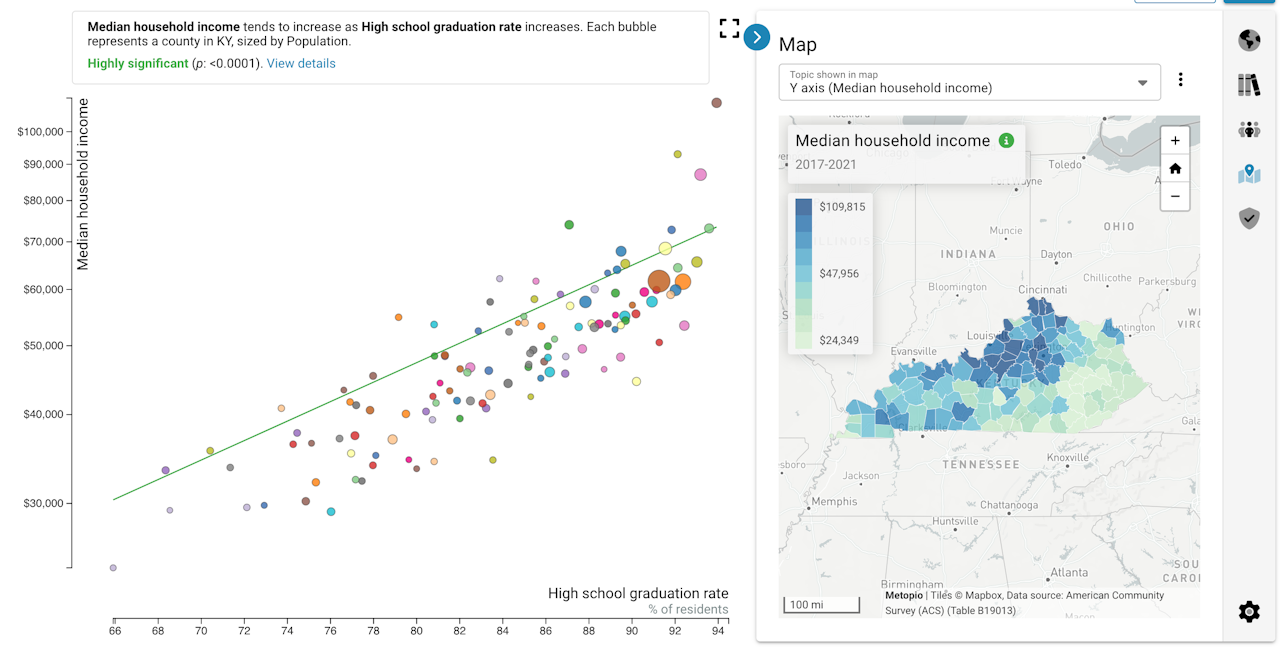
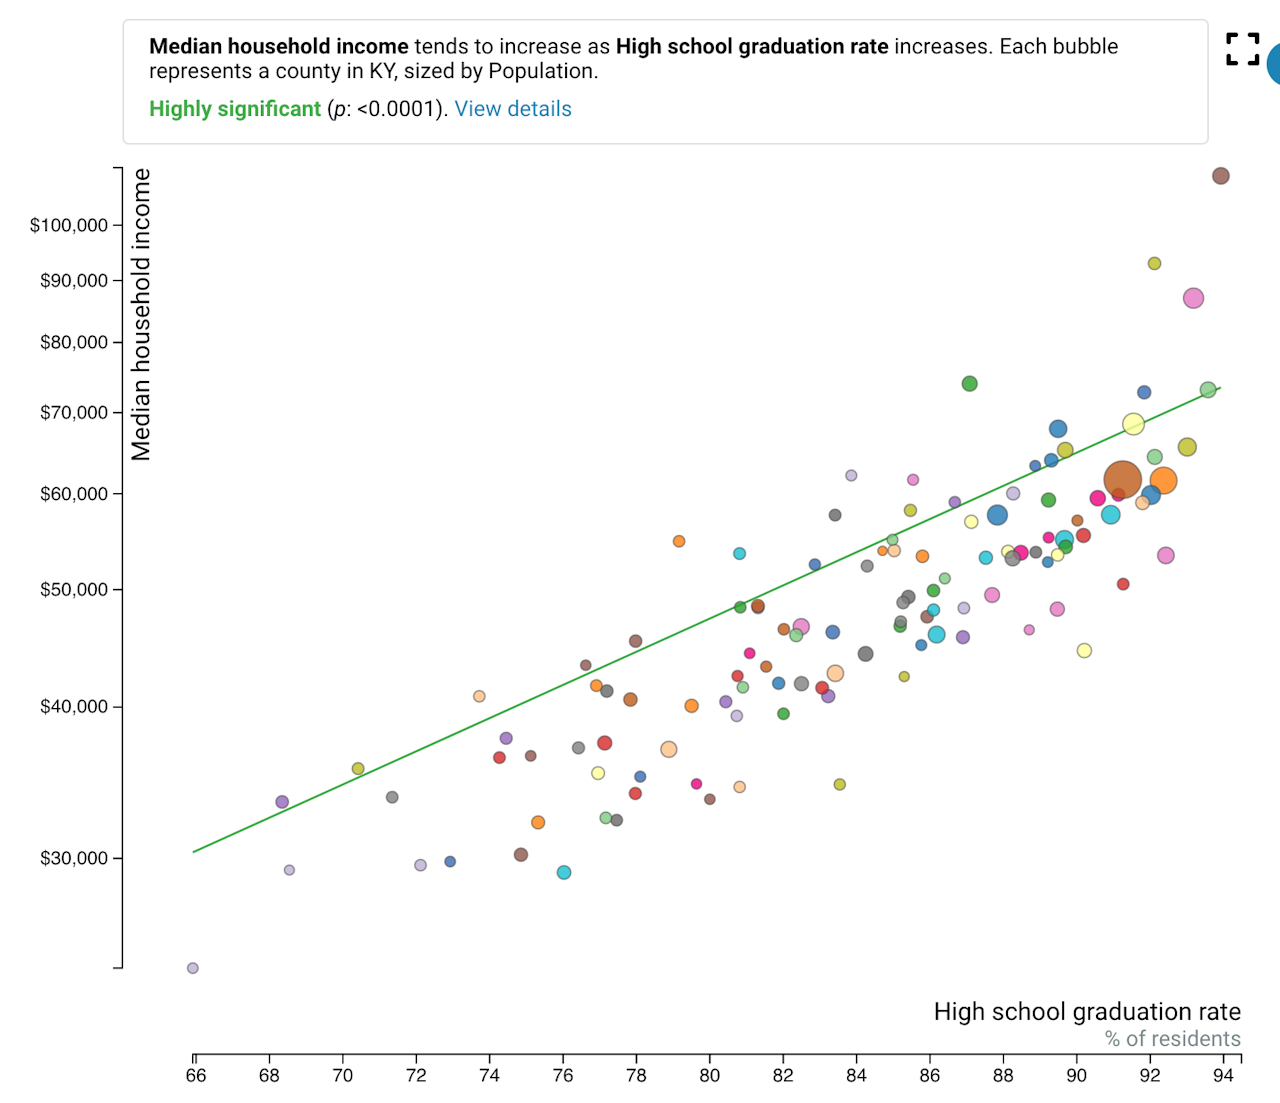
A scatterplot lets you look at multiple topics and places at the same time. where each bubble in the scatterplot represents a different place.
Three different topics are shown in this scatterplot:
1. one on the horizontal (X) axis,
2. one on the vertical (Y) axis,
3. and one in the size of the bubbles.
Each bubble’s position reflects its values along the X and Y axes. Hover over each bubble to see the data associated with that place.
We recommend you put the topic you want to understand on the Y (vertical) axis, and use the X axis to find topics that appear to be related.
Understanding the map
There is a map connected to this scatterplot showing data from the topic on the Y (vertical) axis. Hover over a bubble to see which place it is, or click the bubble to find it in the map connected to this scatterplot. You can also use the map to locate places in the scatterplot.

The map
Hover over a place in the map or a bubble in the scatterplot to see it highlighted in both places.
Trend Lines
A line is drawn over data in the scatterplot to show the apparent relationship between the X and Y topics. For instance, a line moving upward to the right means that as X increases, Y also tends to increase, for places in the scatterplot. The thickness of the trend line represents how strong the connection between X and Y appears to be (the linear correlation coefficient).

Example trend line
Hover over the trend line for more information about the relationship.
Verification
This scatterplot shows correlation, not causation.
Even if there is a strong apparent relationship in the scatterplot, this could be misleading. The trend could be due to several factors:
There could be a third factor (like income, education, or demographics) that actually affects both the X and Y topics. In this case, X and Y would appear to be related only because they are both related to the other factor. For instance, places with low education also have a lot of people using food stamps, but using food stamps does not lead to poor education, or vice versa - instead, both affect (or are affected by) income.
X and Y could actually be two sides of the same coin. For instance, unemployment and average hours worked may appear to have a strong relationship, only because they both reflect economic conditions - people who are unemployed work few hours.
The relationship could be purely random chance. This happens when viewing a small number of places in the scatterplot (under 50 or so), but is unlikely when looking at hundreds or thousands of places.
There could actually be a true relationship between X and Y, where one contributes to the other.

Verify it
How do you know whether the relationship is genuine?
Verify it.
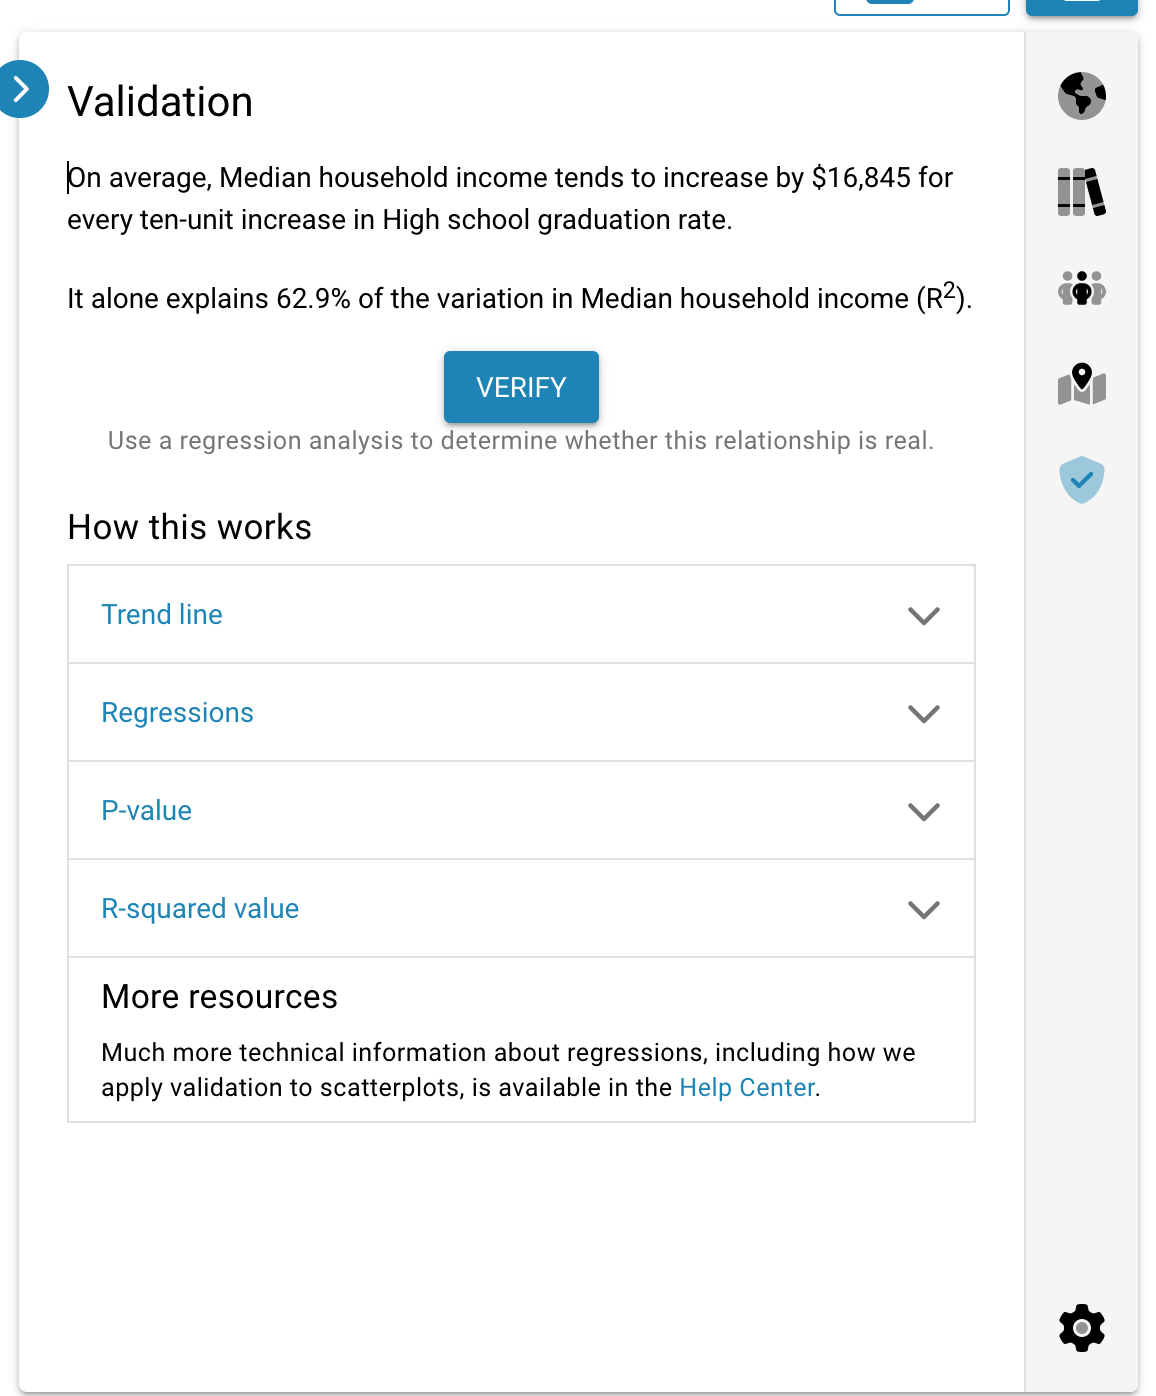
Click the Verify button to test the relationship between the X and Y axes using a controlled multi-variable regression. Effectively, this removes some commonly related factors from the equation, including demographics, income, and education. Click on the button after running the verification to learn more about the results.
Additional notes
The scatterplot tries to use the same stratification and time period for the X, Y, and Size topics, but this isn’t always possible. Look at the labels on the axes to understand what data is being shown.
You can use Filters to limit the scatterplot to specific places. When you do this, you can’t verify the scatterplot, because you’ve limited the data in ways that could affect the relationship between the topics.
The colors of the bubbles do not have any meaning.
